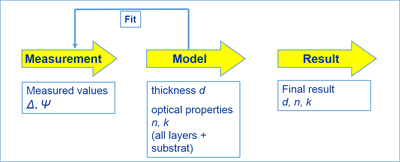
Imaging Ellipsometry essentially applies the same data-analysis procedures as known from regular ellipsometry. The measured Δ-Ψ-maps primarily serve as transfer quantities, from which the physical sample properties of interest are calculated, e.g. layer thickness, refractive index and/or absorption. In general, these values are obtained from computational sample modeling, which contains the unknown sample properties as floating parameters and compares the model against the measured data. By means of regression analysis, the model yields the final values of the free parameters that yield the best match of the computed model and measured data (Fig.1).
Additionally, the (hyperspectral) Δ-Ψ-maps also carry the structural information of the sample surface (after all, they are microscope images!) which would be omitted by non-imaging measurements. This allows combining ellipsometric data analysis with image analysis tools from microscopy and hyperspectral imaging:
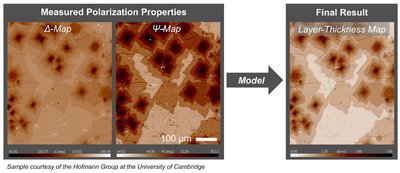
- The entire Δ-Ψ-maps may be converted into images of the physical sample properties, e.g. images showing the layer-thickness distribution across the measured surface (Fig.2).
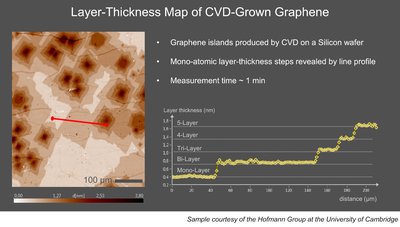
- Tools like histograms, cross-sections and line-profiles help to identify structure irregularities, assess the value distributions, and tell apart step-like and gradient surface features (e.g. layer-thickness steps and gradients; Fig.3).
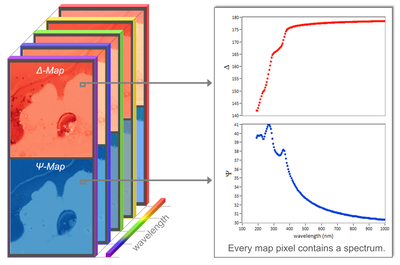
- The spectra of any group of pixels might be extracted after the measurement, e.g. to analyze the layer thickness and material properties of different parts of the imaged sample surface separately (Fig.4).
- The images itself may reveal unexpected surface properties such as residual cleaning contaminants or damages, which might skew the modelling results if they remained disclosed to the examiner, e.g. in regular (non-imaging) ellipsometry.


